Live Performance
Grufity Portfolio Performance vs S&P 500
A live, real-time test of the Grufity model — rebalanced every two weeks against the S&P 500.Grufity High Scoring Large Caps vs S&P 500
Our model selects high-potential stocks competing directly with the index.Growth of $100,000
Grufity $1,024,900
S&P 500 $354,800
- Grufity
- S&P 500
Grufity$1,024,900+924.9%
S&P 500$354,800+254.8%
Alpha+670.10%Outperforming
Who is Winning?
| Period | Model | S&P 500 | Result |
|---|---|---|---|
| Past Quarter | 6.89% | 7.16% | +2.2% |
| Past Year | 39.4% | 23.89% | +21.0% |
| Past 3 Years | 40.68% | 22.79% | +22.7% |
Portfolio
| Ticker | Weight |
|---|---|
| ****L | **% |
| ****G | **% |
| ****F | **% |
| ****R | **% |
| ****I | **% |
Yearly Performance
| Year | High Scoring Large Caps | S&P 500 | Result |
|---|---|---|---|
| 2026 | 20.58% | 8.98% | Beats market by 11.6% |
| 2025 | 37.8% | 16.35% | Beats market by 21.4% |
| 2024 | 44.99% | 23.3% | Beats market by 21.7% |
| 2023 | 38.44% | 24.29% | Beats market by 14.1% |
| 2022 | 3.53% | -19.48% | Beats market by 23% |
| 2021 | 33.13% | 27.04% | Beats market by 6.1% |
| 2020 | 12.48% | 16.16% | Lags market by -3.7% |
| 2019 | 32.47% | 28.79% | Beats market by 3.7% |
| 2018 | -8.59% | -6.35% | Lags market by -2.2% |
Grufity High Scoring Mid Caps vs S&P Mid-Cap ETF
Our model selects high-potential stocks competing directly with the index.Growth of $100,000
Grufity $943,800
S&P Mid-Cap ETF $252,800
- Grufity
- S&P Mid-Cap ETF
Grufity$943,800+843.8%
S&P Mid-Cap ETF$252,800+152.8%
Alpha+691.00%Outperforming
Who is Winning?
| Period | Model | S&P Mid-Cap ETF | Result |
|---|---|---|---|
| Past Quarter | 17.05% | 11.86% | +5.2% |
| Past Year | 42.83% | 21.77% | +21.1% |
| Past 3 Years | 128.14% | 44.46% | +83.7% |
Portfolio
| Ticker | Weight |
|---|---|
| ****H | **% |
| ****E | **% |
| ****A | **% |
| ****D | **% |
| ****E | **% |
Yearly Performance
| Year | High Scoring Mid Caps | S&P Mid-Cap ETF | Result |
|---|---|---|---|
| 2026 | 19.43% | 14.44% | Beats market by 5% |
| 2025 | 42.08% | 5.92% | Beats market by 36.2% |
| 2024 | 20.7% | 12.41% | Beats market by 8.3% |
| 2023 | 35.5% | 14.57% | Beats market by 20.9% |
| 2022 | -5.96% | -14.55% | Beats market by 8.6% |
| 2021 | 35.02% | 23.17% | Beats market by 11.9% |
| 2020 | 37.41% | 11.69% | Beats market by 25.7% |
| 2019 | 17.35% | 23.94% | Lags market by -6.6% |
| 2018 | -14.36% | -12.51% | Lags market by -1.8% |
Discover The Joy of Investing
Explore, screen, and track your portfolio with institutional-grade data. Invest smarter, not harder.
Why Grufity
Experience Powerful Data
Grufity provides the historical trend of financial metrics — not just point-in-time values. Knowing the history of a stock's price-to-sales ratio puts today's value in the right context.
"...eliminates the gap between hedge funds and retail investors."
Easy Access
All the financial data and tools you need, in one place
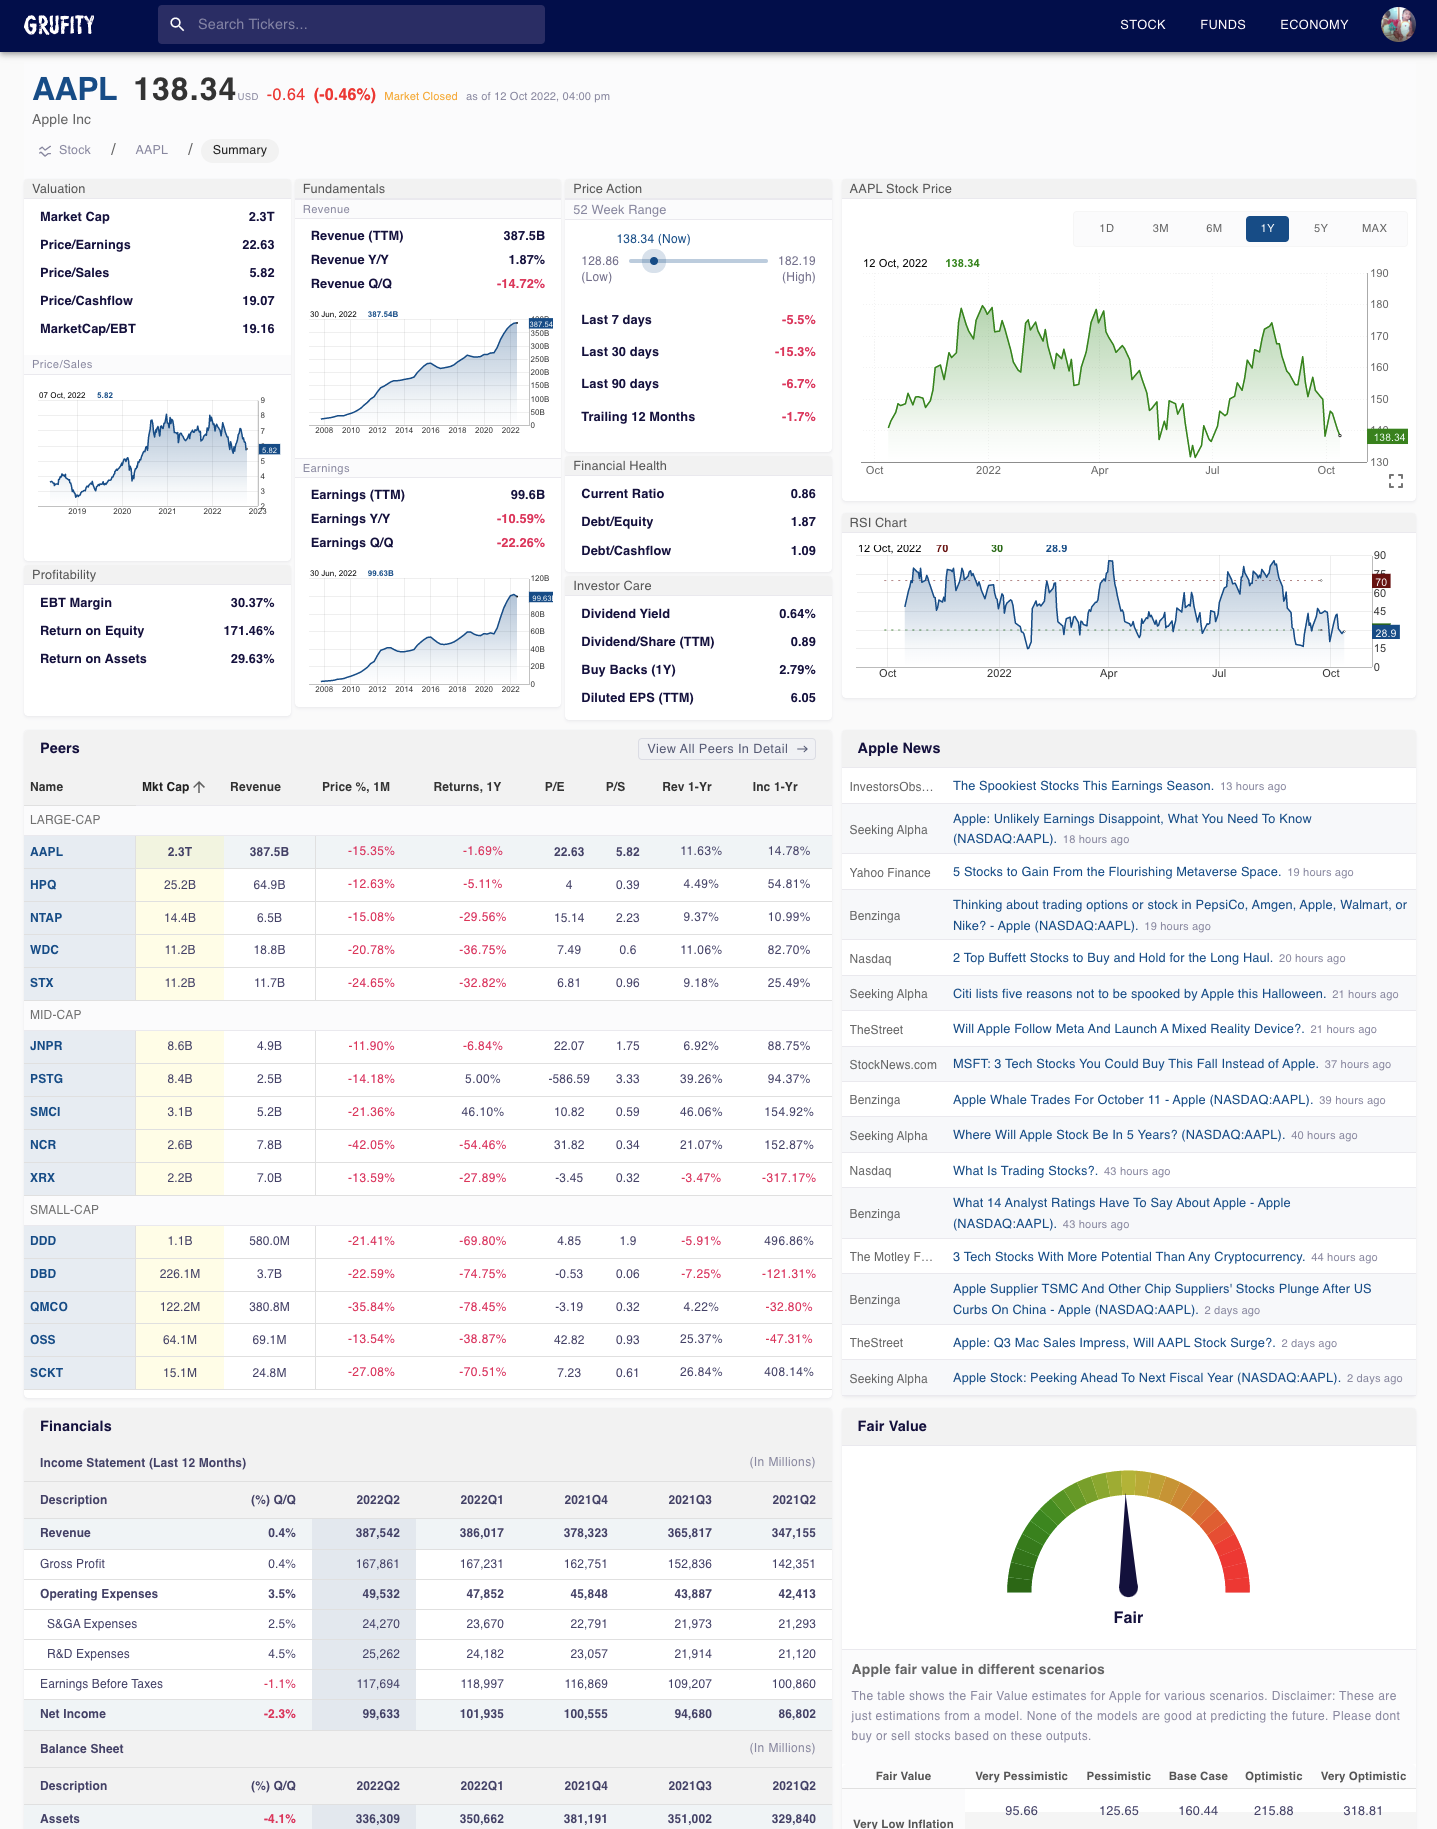
Stocks
The best place to do your due diligence on any stock. Detailed historical trends on financial ratios — PE, PS, ROE, ROA, Debt/Equity, and more.
Insider trading trends and alerts. Are funds buying or selling? Latest financial reports and news.
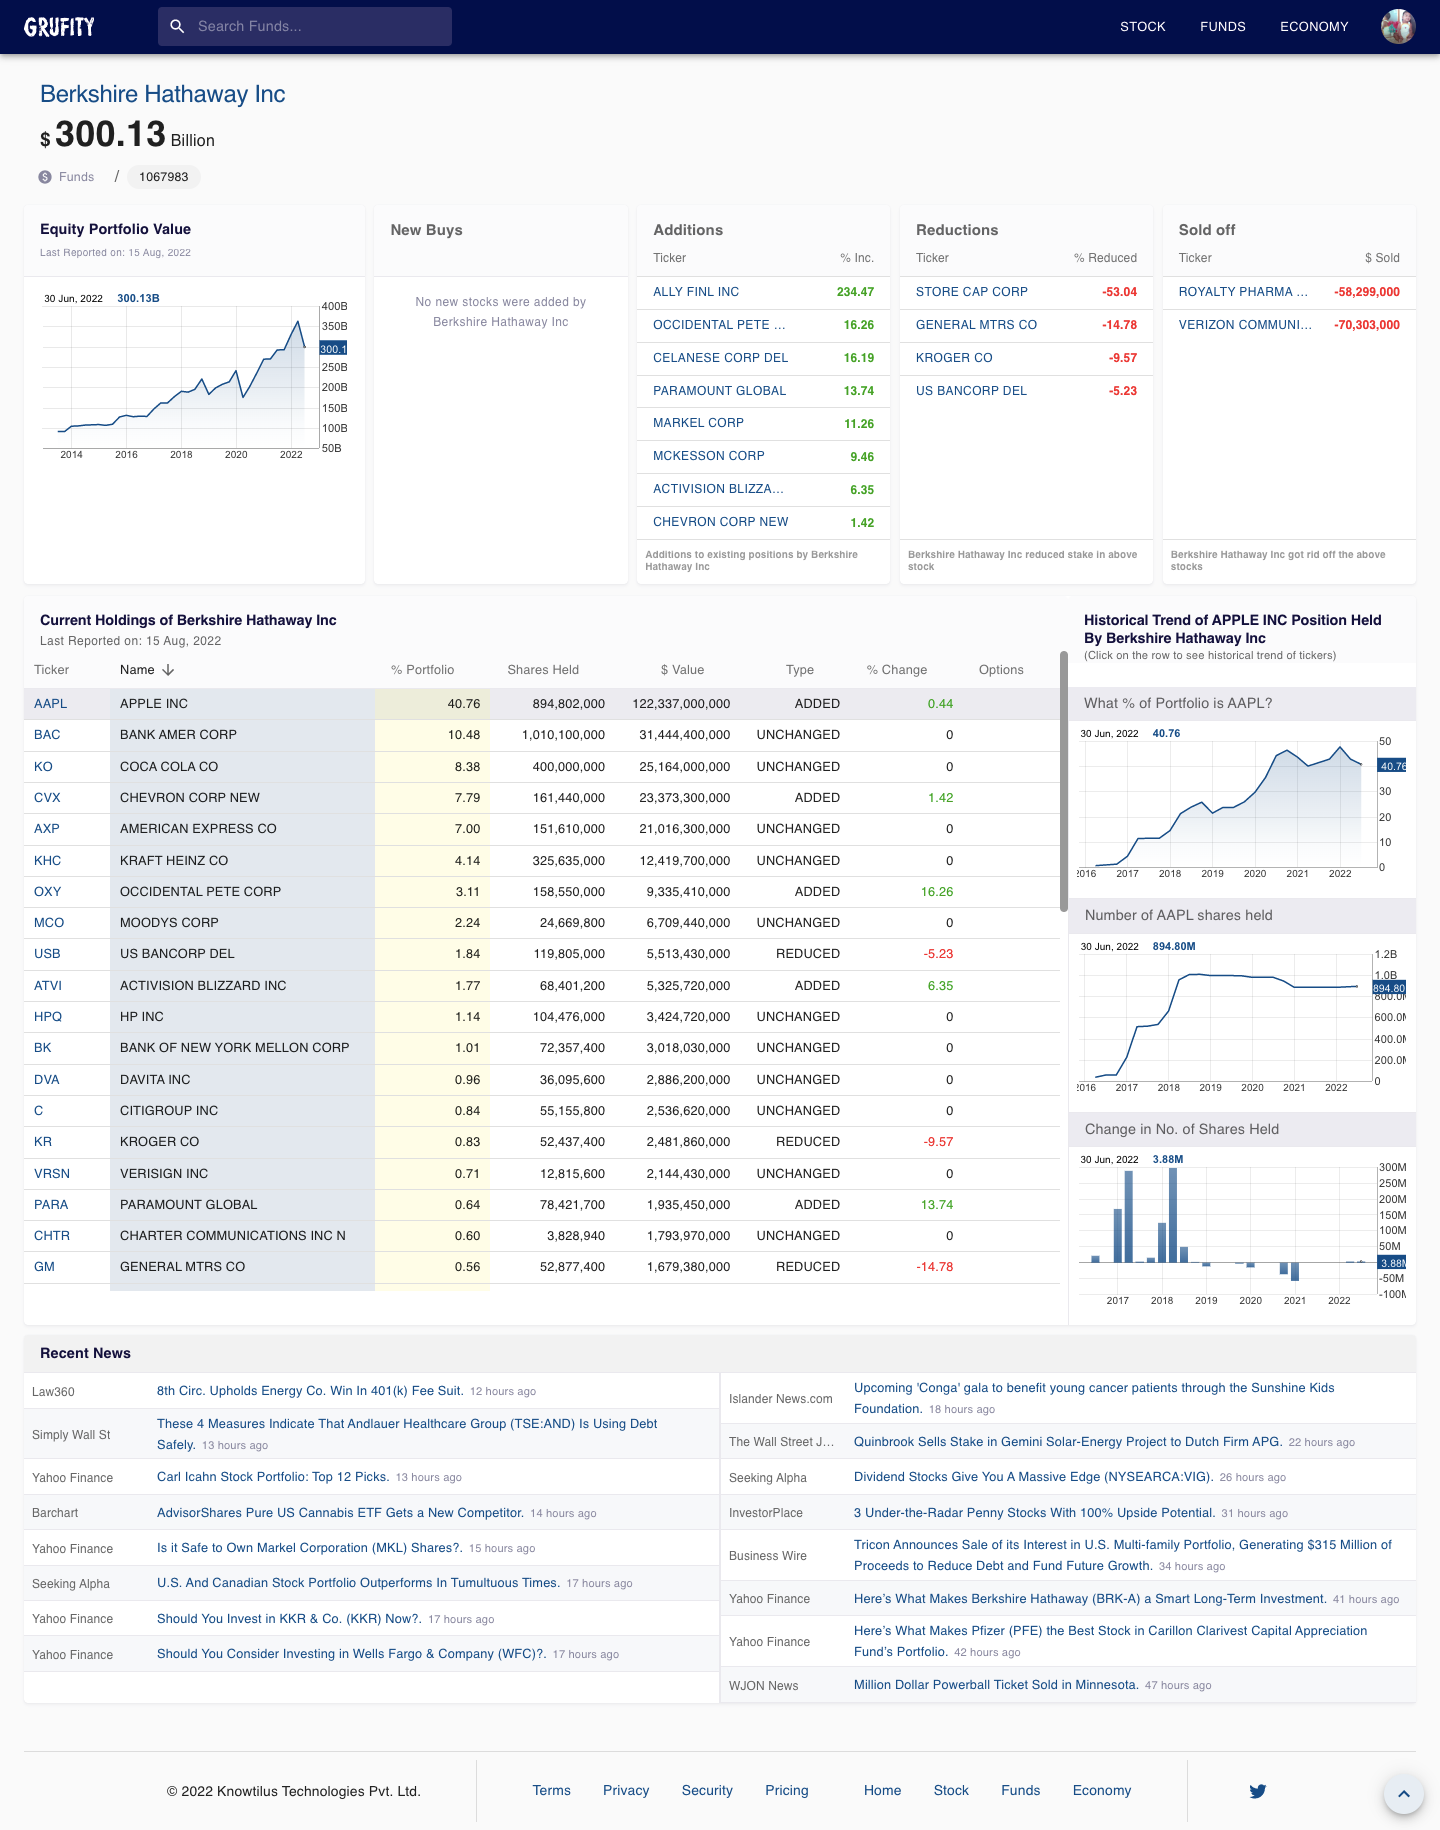
Funds
A powerful tool for shadow investing. Coverage of all major hedge funds.
Current holdings, recent buys and sells, position size changes, and historical trends of how funds change their positions over time.
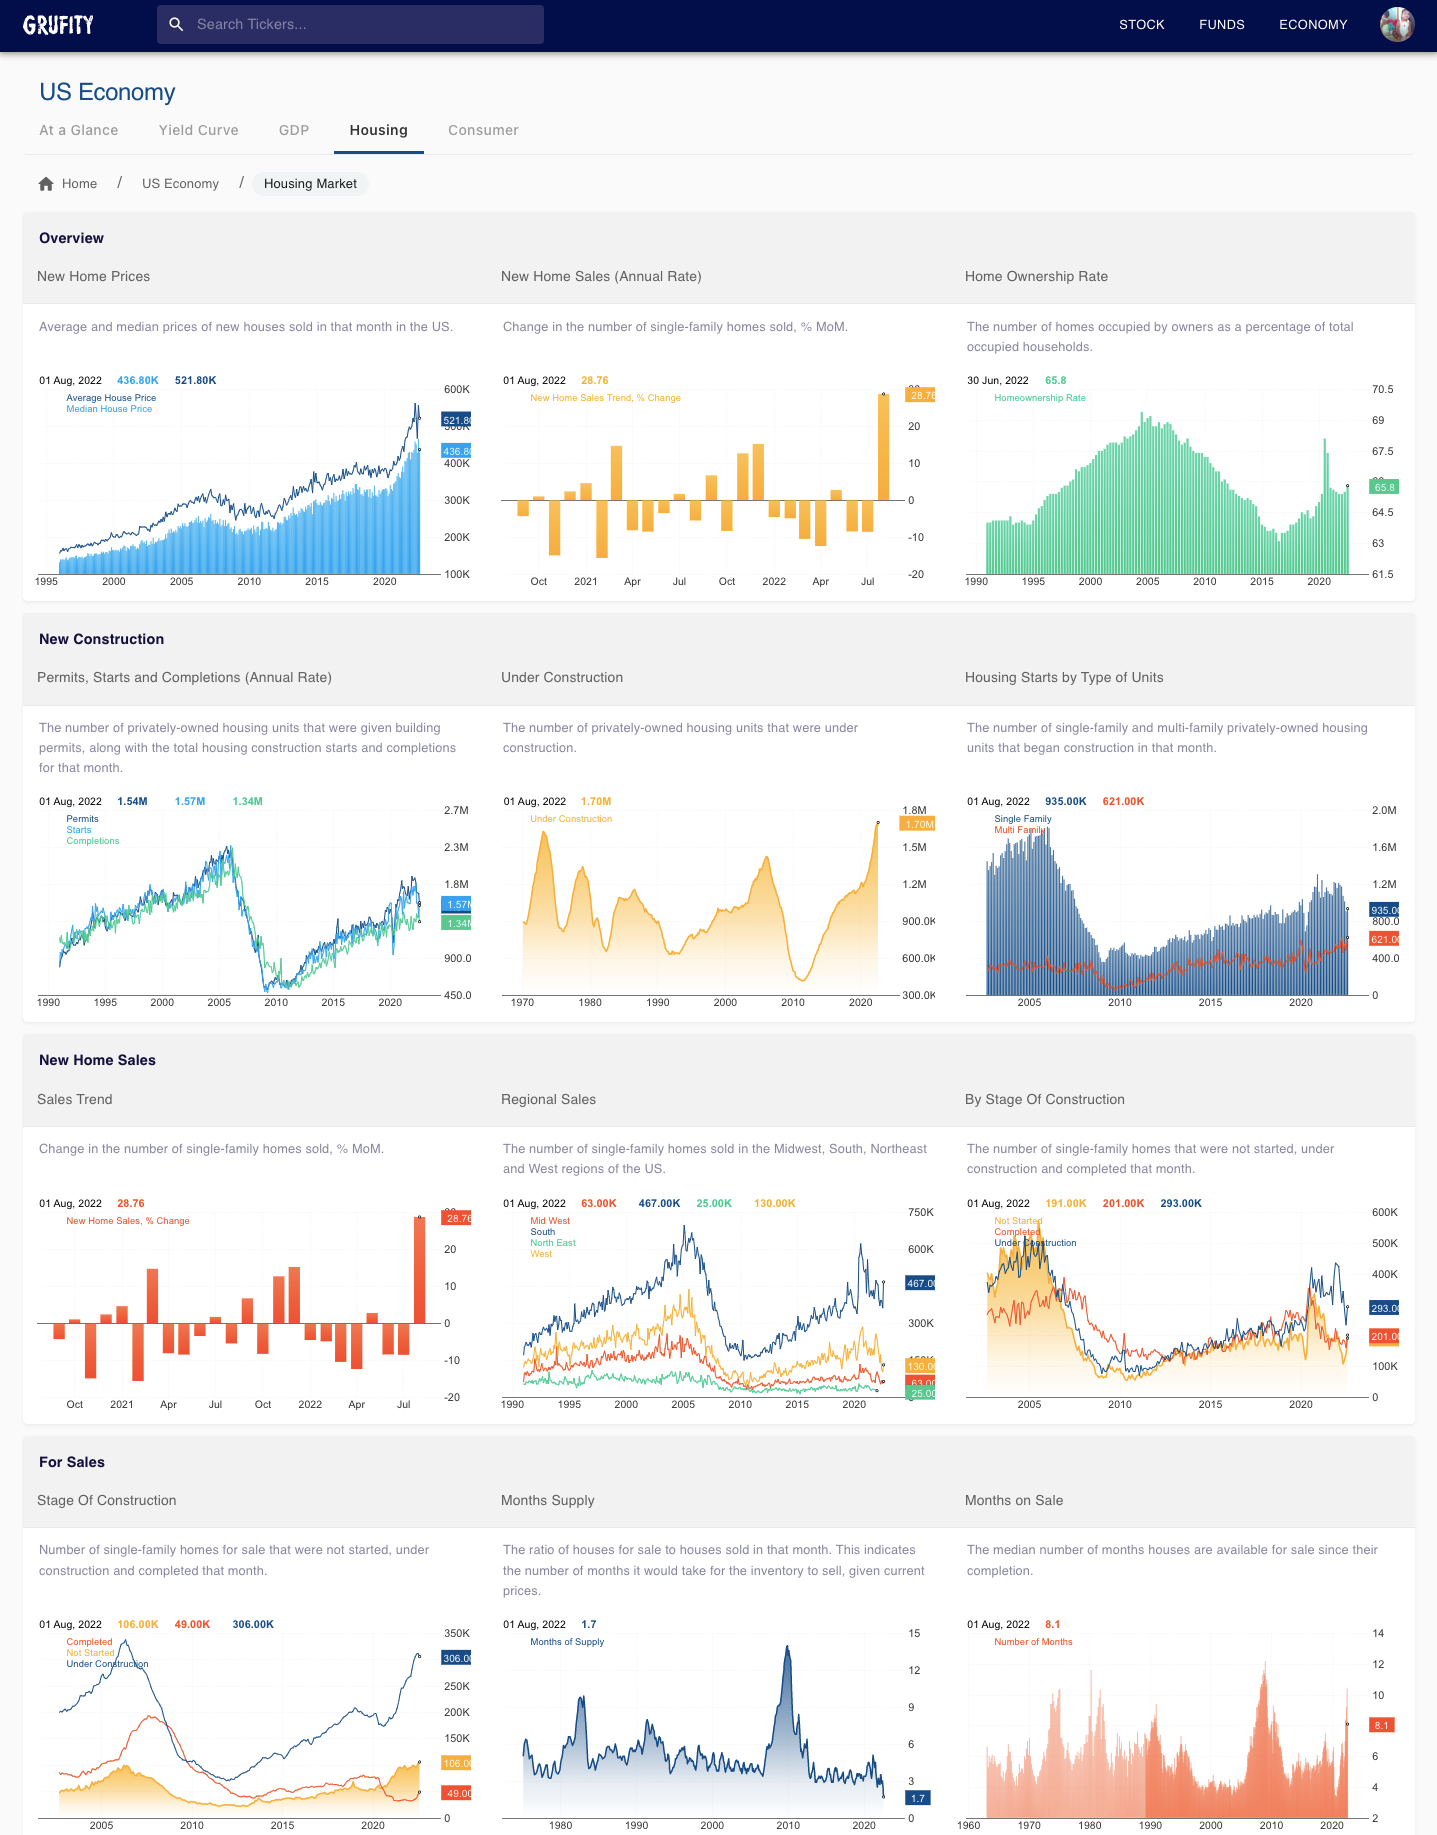
Economy
Yield Curve: Daily updated analysis and recession prediction.
Inflation: Quick view of CPI, PCE, and trends.
GDP: Breakdown and past trends.
Housing: Detailed charts on the sector that impacts us all.
Consumer: Two-thirds of the economy is consumption.
Inflation: Quick view of CPI, PCE, and trends.
GDP: Breakdown and past trends.
Housing: Detailed charts on the sector that impacts us all.
Consumer: Two-thirds of the economy is consumption.
Pricing
Institutional-grade data — for the price of a coffee
MOST POPULAR
Premium Plan$25.00/mo
$300 billed yearlyCancel anytime · Secure checkout via Stripe"Rule No. 1 is never lose money."
— Warren BuffettNever buy a stock without a complete look at Grufity.
Features
A 360° view on Stocks and Economy
Intuitive query language to filter stocks any way you like instead of pre-canned bins. Save as many Screens you like. | |
|---|---|
Quickest way to perform due-diligence on any stock. Most comprehensive and in-depth one-pager on the internet. | |
Equity portfolio of 1000s of active funds such as Buffett, Carl Icahn, Cathie Woods etc. What stocks are the funds buying or selling? Historical trend of purchase of a stock by a fund | |
Get most comprehensive analysis on daily movement of yield curve on the internet. | |
Great tool for stock discovery especially for lesser known micro-caps and mid-caps. Which stocks made 52-week highs? Which stocks had the most earnings in the industry? Which stocks were crushed recently? Which have been multi-baggers ? | |
Are funds buying or selling the stock? What funds have sold the stock? Which opened new positions? Trend of number of funds interested in the stock. | |
Quick look at the Insider Transaction as on a stock. Have there been any unusual sales by insiders? Are the insiders selling at a faster or slower speed than before? | |
What are the historical Year-over-Year Returns, Rolling returns etc.? | |
What is the probability of a 20 or a 40% paper loss on a stock? What has been the historical drawdown on the stock? How is stock's volatility vs S&P500? | |
History of important ratios for stocks. Valuation Metrics - Trends for PE, Price-to-Sales, EV/EBT etc. Profitability Metrics - ROE, Return-On-Assets etc. Financial Health - Debt-to-Equity Ratio, Current Ratio etc. Operational Performance - Asset-to-Sales Ratio, Sales-to-Inventory etc. | |
Important tables from financial statements reported by companies. Hundreds of time series per stock such as Revenue (Trailing 12 Months), Income Growth, Assets Growth etc. | |
Alerts are activated on every stock on unusual activities such as - High insider trading activity Big loss in Income or a dip in revenue Unusual interest from funds |
Don't just follow experts
Aim to be one
If you have been mostly looking at the price chart and hoping to make a quick buck on a stock, then chances are that you haven't yet discovered the true joy of investing. Price charts are important but they are just one clue out of many. The real joy of investing is in exploring many stocks and finding a few gems that will multiply your investments over the years.Support